You search your main service on Google and see the same rival in the map pack, the organic results, a FAQ snippet, maybe even a video result. Then you search a nearby city and it happens again. It feels like they own the page and your business barely exists.
Most small businesses describe that problem emotionally. “They’re everywhere.” That feeling is real, but it also has a name: seo share of voice.
This metric matters because it turns frustration into something you can track. Instead of asking why Google seems unfair, you can ask better questions. Which keywords are they winning? Which pages are pulling visibility? Which search features are taking attention away from everyone else? And where can you take space back without burning your budget?
For local companies, startups, and multi-location brands, that shift in thinking is huge. You don’t need to dominate the whole internet. You need to own the searches that move buyers closer to a call, a quote request, or a visit.
Why Your Competitors Seem to Be Everywhere on Google
A common scenario looks like this.
A roofing company in Dallas searches “roof repair near me.” One competitor appears in the local pack. The same competitor ranks organically. Their review pages show up. A “people also ask” result expands with content from their site. The business owner thinks, “How are they beating us in every direction?”

That’s not just ranking strength. It’s share of visibility across the search experience.
In 2025, the top three organic search results capture approximately 68.7% of clicks, while AI Overviews appeared on 13.1% of U.S. desktop queries by March 2025 and zero-click searches reached roughly 69%. That’s why modern visibility has to include more than blue links, according to verified 2025 search data on click distribution, AI Overviews, and zero-click behavior.
Why this feels worse than it used to
Google’s results page is crowded. A competitor can win attention without owning the top organic listing.
They can show up through:
- Local presence if they have stronger location signals and reviews
- Content depth if they’ve built pages for service, city, problem, and comparison searches
- SERP features if Google pulls their FAQs, snippets, videos, or branded pages
- Authority signals if their site is easier for search engines to trust and interpret
If you want a practical way to study who’s taking those positions and why, this guide on How to Conduct Competitor Analysis is useful because it pushes you to compare real competitors, not just the companies you notice most often.
Practical rule: If a competitor appears in multiple search features for the same topic, they’re not just “ranking well.” They’re controlling more share of voice than you are.
That’s also why supporting metrics matter. If you’re trying to understand the trust and authority side of visibility, this breakdown of https://x8webdesign.com/2026/04/what-is-domain-authority-in-seo/ helps clarify one of the signals many business owners hear about but rarely define correctly.
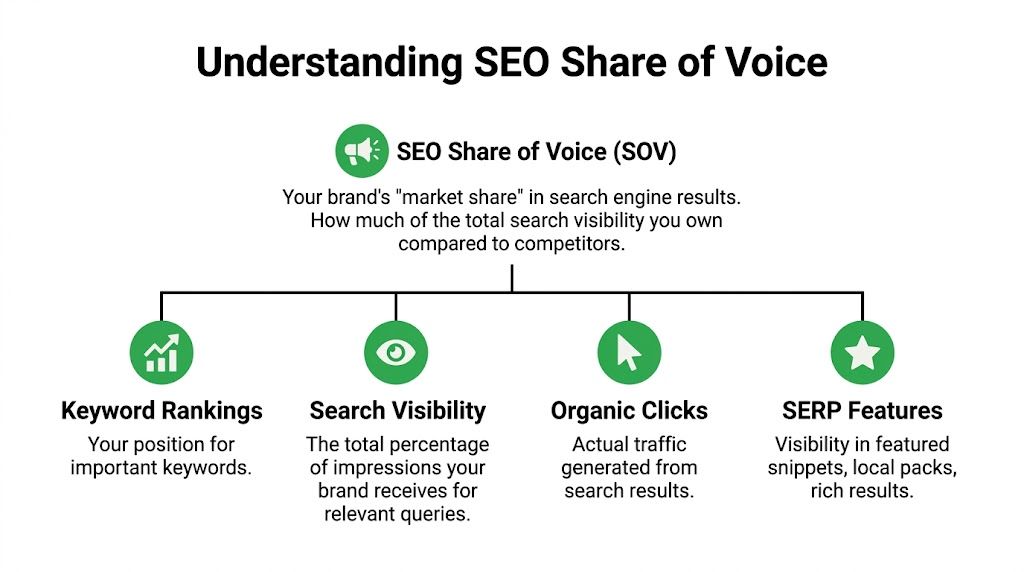
What Is SEO Share of Voice Really
SEO share of voice is your brand’s share of the total search visibility available in your market.
The easiest way to think about it is this: Google is a shelf, and every competitor is fighting for shelf space. Your seo share of voice tells you how much of that shelf your brand occupies.
If you only look at one keyword, you miss the complete picture. A business can rank first for its own name and still be mostly invisible for the category searches that generate new leads. Another business might not have strong branded demand yet, but it could still own a large portion of commercial-intent searches in its area.
SOV is visibility, not demand
Here, people get confused.
Share of Voice measures how visible you are across search ecosystems. Share of Search measures how often people actively search for your brand compared to competitors. That distinction matters because they answer different business questions, as explained in this guide to Share of Voice versus Share of Search and voice search behavior.
A simple way to separate them:
- Share of Voice asks: How often does my business show up?
- Share of Search asks: How often do people ask for my business by name?
The same source notes that 41% of American adults use voice search daily, which matters because conversational searches often reward brands that create natural-language answers, even when those brands aren’t yet winning lots of branded searches.
What counts toward seo share of voice
For small businesses, SOV usually includes more than ranking positions. It can include your visibility in:
- Standard organic listings
- Featured snippets and FAQ-style results
- Local packs for geo-intent searches
- Video and image results
- Branded and non-branded keyword sets
- AI-influenced search features, depending on the tracking setup
That last point matters because modern search isn’t one neat list of ten links anymore.
A plain-language example
Say you own a web design firm serving Austin, Dallas, and San Antonio.
If you rank for your brand name, that helps. But your seo share of voice really grows when your site also appears for searches like:
- web design company in a target city
- ecommerce website redesign
- seo web design services
- affordable website design for small business
- website redesign checklist
- local landing pages for each market
One page rarely wins all of that. Strong SOV usually comes from a collection of pages that support each other.
The businesses that look “big” in Google often aren’t winning because of one magic page. They’ve built enough content and location depth to appear repeatedly across related searches.
Why this metric is useful
A lot of SEO reporting hides behind averages. Average position can look fine while traffic stays flat. Total keyword count can rise while leads don’t.
SOV is better because it pushes you to ask a more strategic question: How much of the useful search visibility do we control compared with the companies we’re trying to beat?
That’s a more honest way to judge search performance, especially if you operate in a crowded local market or across multiple cities.
How to Calculate Your SEO Share of Voice
You don’t need enterprise software to understand the math behind seo share of voice. A spreadsheet and a sensible keyword list can take you a long way.
There are two common ways to calculate it. The first is simple and quick. The second is better because it reflects how search traffic works.
The simple model
The traditional formula is:
(Your brand mentions ÷ total mentions in category) × 100 = SOV%
That version is useful as a concept, but it’s too broad for practical SEO work. Search results aren’t equal. One ranking spot on a high-value keyword matters more than a weak appearance on a low-intent term.
So for SEO, most useful calculations weight visibility by keyword value and ranking position.
The traffic-based model
A stronger method uses Traffic Forecast.
The formula is:
Your SoV (%) = [your site’s TF for selected keywords / all sites’ total TF for the same keywords] × 100%
That approach is described in this traffic forecast method for share of voice calculation. It’s more accurate because it accounts for search volume and the steep click drop that happens as rankings move down the page.
What TF means in plain English
Traffic Forecast is an estimate.
For each keyword, you take:
- Search volume
- Estimated CTR for your position
Then you multiply them.
If a keyword has meaningful demand and you rank high, it contributes more to your SOV. If a keyword is tiny or you rank low, it contributes less.
That’s why this model beats simple rank tracking. It reflects actual opportunity, not vanity.
A small business example
Let’s say you track one keyword group around “website design” in a target city.
If your page sits in a stronger position than a competitor, your estimated traffic share for that keyword group is higher. If they control more high-intent pages across the same cluster, their SOV rises.
Here’s a simplified table structure you can use in a spreadsheet.
| Competitor | Rank | Est. CTR | Est. Traffic (Volume x CTR) | Share of Voice |
|---|---|---|---|---|
| Your Site | 1 | Higher CTR based on position | Volume x CTR | Portion of total TF |
| Competitor A | 2 | Lower than position 1 | Volume x CTR | Portion of total TF |
| Competitor B | 4 | Lower than top results | Volume x CTR | Portion of total TF |
| Competitor C | 7 | Lower still | Volume x CTR | Portion of total TF |
Notice what the table does. It doesn’t ask only, “Who ranks?” It asks, “Who captures the most estimated traffic from this keyword set?”
How to build a useful keyword set
The keyword set you choose shapes the result. If the set is sloppy, the SOV number is sloppy too.
Use a mix of:
-
Core service terms
These are your main money keywords. -
Location-modified terms
Add city, region, and “near me” variations where relevant. -
Problem-aware searches
These often convert well because the user is already trying to solve something. -
Adjacent intent terms
These catch buyers earlier in the research process. -
Branded terms
Keep these separate from non-branded terms so your reporting stays honest.
Quick check: If your keyword set only includes your favorite head terms, your SOV report will flatter you or punish you unfairly. Include the phrases customers actually use across the buying journey.
A manual workflow that works
If you’re doing this without expensive software, use a monthly spreadsheet.
Track:
- Keyword
- Search volume
- Your ranking
- Competitor rankings
- Estimated CTR by position
- Estimated traffic forecast
- Total TF for all tracked sites
- Your resulting SOV
Then compare month over month.
What matters most is consistency. Don’t change your keyword set every week or your trend line becomes useless.
When to use a tool instead of a spreadsheet
A spreadsheet is enough when:
- you serve one market
- your keyword set is modest
- you want strategic clarity before buying software
A tool helps when:
- you’re tracking multiple cities
- competitors shift often
- you need faster reporting for clients or leadership
- you want URL-level and keyword-gap views
If you’re building the foundation first, this guide to https://x8webdesign.com/2026/04/how-to-do-an-seo-audit/ is a smart companion because audit work usually reveals the pages, gaps, and technical issues that affect SOV before you ever open a tracking tool.
Comparing SEO SOV Tools and Their Approaches
Different tools talk about visibility in different ways. Some emphasize positions. Some estimate traffic. Some blend both into proprietary scores.
That’s why business owners get confused when one dashboard says progress is strong and another looks flat. Often, the tools aren’t measuring the same thing.
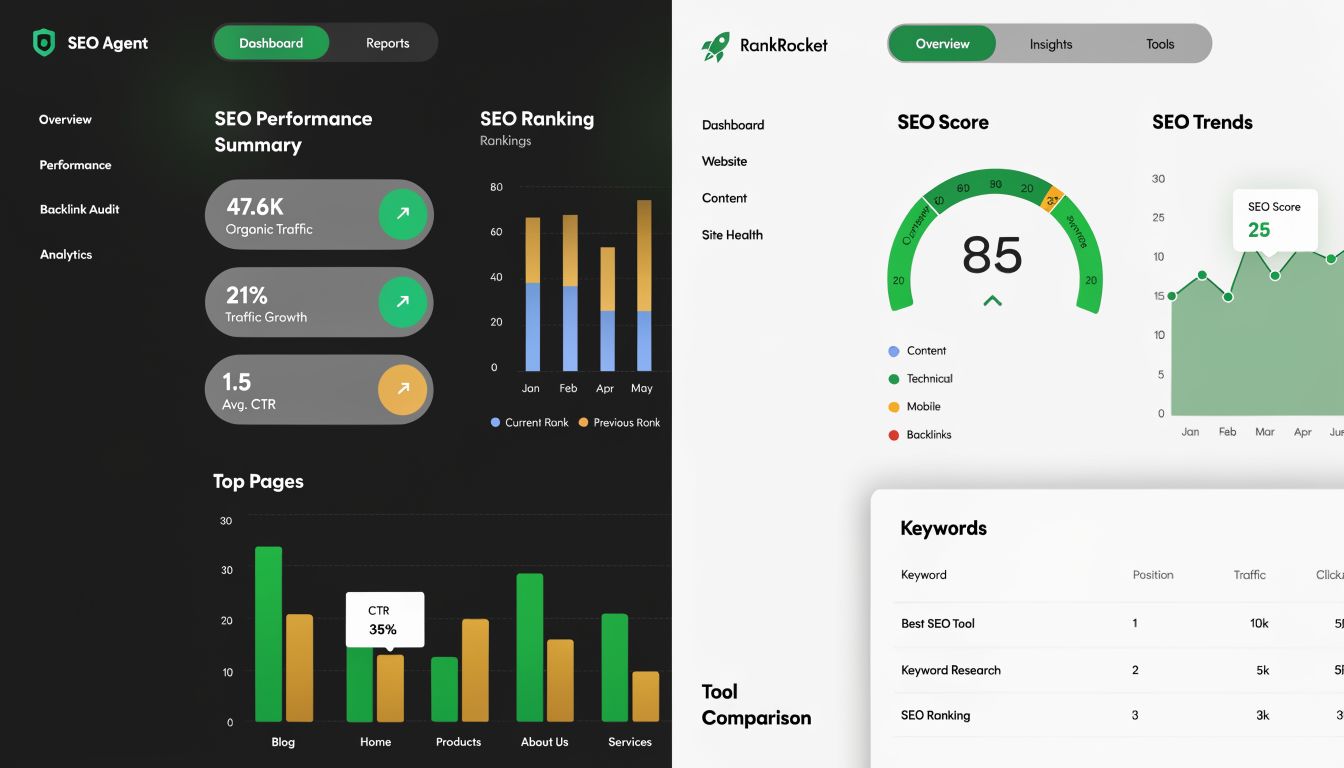
Position-based visibility tools
Tools like Semrush, Ahrefs, and Moz all help track competitive search visibility, but their dashboards package the data differently.
Position-based approaches tend to answer questions like:
- Are we appearing more often?
- Are we moving into stronger average positions?
- Are competitors gaining ground on shared keywords?
This is useful for spotting momentum. It’s also easier for non-specialists to read quickly.
The downside is that a position-only view can flatten reality. A move on a minor keyword can look similar to a move on a commercial term that drives leads.
Traffic-weighted approaches
Traffic-weighted methods are closer to true seo share of voice because they value rankings based on likely click opportunity, not just position labels.
That’s where traffic forecast style calculations become more useful for strategic decisions. They help answer:
- Which competitor owns the highest-value demand?
- Which pages contribute the most market visibility?
- Which keyword clusters are worth fighting for first?
For agencies and in-house teams, this method is usually better when revenue matters more than report aesthetics.
What each major platform is good at
Here’s the practical view.
| Tool | Best use case | Strength | Limitation |
|---|---|---|---|
| Semrush | Broad competitive tracking | Strong position tracking and market comparisons | Visibility scores can feel abstract if you want page-level reasoning |
| Ahrefs | Keyword and content gap analysis | Useful for discovering who ranks where and why | Can still require interpretation if leadership wants one clean SOV number |
| Moz | Simpler monitoring for many teams | Accessible interface for ongoing visibility checks | Less depth for advanced competitive modeling |
| SE Ranking | Competitor and top-20 analysis | Helpful views into competitor URLs and keyword overlap | Still depends on keyword set quality |
How to choose based on your business type
A local service company doesn’t need the same setup as a multi-location brand.
For a single-location business, a lighter stack often works if it can track local keyword groups, competitor overlap, and page-level movement.
For a multi-location business, the tool has to separate visibility by market. Otherwise, strong performance in one city can hide weak visibility in another.
Look for a platform that lets you compare:
- Branded versus non-branded visibility
- City-level keyword groups
- Winning competitor URLs
- SERP feature presence
- Trends over time, not one-off snapshots
The best SOV tool isn’t the one with the prettiest dashboard. It’s the one that helps you decide what to build next.
Don’t let the tool define the strategy
This matters more than often recognized.
A dashboard can tempt you to chase whatever metric is easiest to improve. That can mean tracking dozens of low-value keywords, celebrating visibility gains that don’t produce leads, or overreacting to small weekly changes.
Use the software to support the business question. Don’t let the software become the business question.
If your sales team needs more qualified demand in Dallas, your SOV setup should focus on Dallas service intent, not a broad national keyword vanity list. If your company is expanding into new markets, the reporting should isolate those markets so you can see whether visibility is taking hold.
Setting Realistic SOV Benchmarks and Goals
Most articles answer “What’s a good share of voice?” with one neat number. That’s a bad way to set SEO goals.
A startup, a niche B2B firm, and a multi-location service company should not judge themselves by the same benchmark. Search markets don’t work that way.
According to this segmented benchmark guidance for share of voice, market leaders often aim for 25% to 35% SOV, new entrants can succeed with 3% to 5% when focused on emerging long-tail terms, and niche B2B firms can reach 40% to 60% in a tightly defined subcategory.
What a good SOV looks like depends on scope
If you run a broad local service business in a major metro, your market is noisy. You may compete with large directories, established local firms, and companies that have been publishing for years.
If you sell a specialized B2B service with narrow terminology, the total search universe may be smaller, but targeted dominance is more achievable.
That’s why targeted dominance beats broad mediocrity.
Benchmarks by business type
Here’s a more useful way to think about goals.
| Business type | Practical SOV view | What success usually looks like |
|---|---|---|
| Startup or new entrant | Narrow category and long-tail focus | Winning a small but commercially relevant slice of demand |
| Local service company | Geography plus service combinations | Owning the searches most likely to produce calls and leads in priority cities |
| Niche B2B firm | Tight subcategory domination | Becoming the default visible option inside a specialized topic area |
| Multi-location business | Market-by-market visibility | Consistent presence across each service area, not just one flagship market |
For startups and newer sites
If your site is new, chasing broad head terms too early usually wastes time.
A better SOV target is concentration. Own a smaller cluster first. That could mean a service plus city, a problem plus service, or an underserved specialty.
For example, a younger agency may struggle to rank broadly for “web design,” but could gain traction around more specific commercial searches tied to location or industry.
For local service businesses
Local businesses often make the same mistake. They aim for “top rankings” across everything instead of asking which keywords support booked work.
A plumbing company doesn’t need to dominate every plumbing article query in the country. It needs strong visibility for urgent service, high-value repair, and city-level searches that turn into calls.
That kind of benchmark is narrower, but far more useful.
For niche B2B firms
In this context, broad-market comparisons become dangerous.
A niche B2B company may never look impressive in a general industry report. But inside its exact subcategory, it can become the obvious choice.
That’s often a better commercial outcome than having weak visibility across a massive general market.
Benchmarking rule: Judge SOV inside the market you actually want to win, not the largest market you can name.
For multi-location companies
One national number can hide local weakness.
A multi-location business should break SOV into separate views:
- By city or region
- By service line
- By branded versus non-branded intent
- By location page versus blog/supporting content
A company can look healthy overall while losing badly in the exact city where it wants growth.
If you’re deciding between platforms to track that kind of segmented visibility, this ultimate SEO tool showdown between Serpstat and Ahrefs is helpful because it frames the tradeoffs in a way that’s easier for non-technical teams to compare.
Actionable Strategies to Increase Your SEO Share of Voice
If you want more seo share of voice, don’t start by chasing every keyword your competitors rank for. Start by taking back the parts of the search domain that matter most to your business.

The right strategy is usually less glamorous than people expect. It’s often page structure, keyword targeting, local relevance, stronger internal linking, and better content coverage. Done together, those moves create repeat visibility.
Run a keyword gap analysis that leads to pages
A keyword gap analysis is only useful if it ends with a production plan.
Look at the competitors who consistently appear for the searches you care about. Then separate the missing terms into buckets:
- Money terms your service pages should target
- Support terms that deserve blog or resource content
- Location terms that need city pages or location-specific sections
- SERP feature opportunities where FAQs, videos, or concise answers could help
Don’t dump all missed keywords into one list. Group them by page type and user intent.
That turns “we’re missing visibility” into “we need these pages and this content architecture.”
Build topic clusters, not isolated pages
Small businesses often publish one page and expect it to rank for an entire topic.
Google usually rewards depth. If a competitor owns a topic cluster, they’re more likely to show up repeatedly across related searches. That’s what expands share of voice.
A strong cluster might include:
| Core page | Supporting pages | Why it helps SOV |
|---|---|---|
| Main service page | FAQs, comparisons, process pages, pricing guidance, local variations | Captures more intents around one topic |
| City page | Service details, local proof, localized FAQs | Strengthens geo relevance |
| Resource guide | Problem-based articles and explainers | Wins earlier-stage searches and related SERP features |
This is one reason content planning matters so much more than random publishing. If you need a companion playbook for growth after visibility improves, this resource on https://x8webdesign.com/2026/02/how-to-increase-organic-traffic/ fits well with SOV planning.
One strong page can rank. A connected cluster can occupy search territory.
Expand the kinds of SERP real estate you target
A lot of businesses only optimize for standard organic rankings. That leaves easy visibility on the table.
You can increase SOV by targeting more result types:
- FAQ content for question-based queries
- Video content for demonstrations and explainers
- Comparison pages for evaluation-stage searches
- Local landing pages for city-specific service demand
- Short answer formats that are easier for Google to surface in rich features
A competitor doesn’t need to outrank you in one blue link if they can beat you with a snippet, video, or local result.
Make local intent explicit
For local and multi-location brands, generic service pages rarely do enough work.
You need pages that clearly connect:
- service
- city or service area
- buyer problem
- trust signals
- next step
A city page shouldn’t just swap in a place name. It should reflect the market, the service need, and the language buyers in that area use.
For multi-location companies, each priority market needs its own visibility plan. Treating all cities the same usually produces average performance everywhere.
Tighten internal linking on purpose
Internal links are one of the most overlooked SOV levers.
When you connect pages strategically, you help search engines understand which pages matter most and how your topic coverage fits together. You also help users keep moving through the site.
Useful patterns include:
-
Service to support content
Link your main commercial pages to FAQs, comparisons, and process explanations. -
Support content back to service pages
Don’t let informational articles become dead ends. -
Location hub structures
Connect broader location pages with city-specific service pages where relevant. -
Thematic cross-linking
If two pages help the same buyer solve related problems, connect them naturally.
Improve pages that already have some traction
Not every SOV win comes from publishing something new.
Often, the fastest gains come from pages already sitting close to stronger visibility. Those pages may need:
- better headings
- tighter search intent match
- clearer FAQs
- more specific supporting detail
- stronger internal links
- updated titles and meta descriptions
- richer examples and proof
Many smaller businesses can outperform bigger competitors. Large sites often move slowly. A focused team can improve high-potential pages faster.
Here’s a useful visual walkthrough before you start prioritizing actions:
Match content to the buying journey
A healthy seo share of voice doesn’t come only from bottom-funnel terms.
You also want visibility when buyers are learning, comparing, and narrowing options. The trick is not to treat every stage equally.
A practical mix looks like this:
- Decision-stage pages for core commercial intent
- Comparison content for shoppers choosing between options
- Problem-aware content for users trying to diagnose a need
- Local proof pages for buyers evaluating providers nearby
That gives you multiple entry points without losing commercial focus.
Track progress the right way
If you improve SOV, you should also watch whether the right business outcomes follow.
Check whether stronger visibility is leading to:
- more qualified landing-page traffic
- stronger non-branded discovery
- better lead quality
- wider presence across target cities
- more pages contributing to organic performance
Keep perspective: The point of seo share of voice isn’t to win a prettier dashboard. It’s to become easier to find in the moments that produce revenue.
Frequently Asked Questions About SEO Share of Voice
Is seo share of voice the same as rankings
No.
Rankings are one ingredient. Seo share of voice is broader. It looks at how much of the relevant search environment your brand controls compared with competitors. A site can have a few strong rankings and still have weak overall SOV if competitors appear across more keywords, pages, and search features.
What is generative share of voice
Generative Share of Voice, or GSOV, measures brand visibility inside AI-generated responses such as Google’s AI Overviews. This overview of GSOV and AI response visibility explains the core shift well: traditional SOV tracks presence in search results, while GSOV focuses on whether your brand appears in synthesized answers.
That changes how you optimize. Clear structure, authority, brand consistency, and topic depth become even more important because the goal isn’t just to rank. It’s to be usable and citable in AI-driven summaries.
How should a local business track SOV
Track by market, not only by domain.
If you serve Austin, Dallas, and San Antonio, measure each city separately. Combine city-specific service terms, local informational queries, and branded versus non-branded phrases. That gives you a realistic view of where you’re visible and where competitors still own the conversation.
What about multi-location businesses
Separate your reporting by:
- location
- service line
- page type
- brand versus non-brand
A single blended report can hide underperforming cities. Multi-location companies usually need a dashboard that shows local wins and local gaps side by side.
Is a low SOV always bad
Not necessarily.
A low overall SOV can be perfectly acceptable if you’re new, entering a crowded market, or intentionally focusing on a niche segment. What matters is whether you’re gaining visibility in the searches that support growth.
If your business is winning the right local and commercial-intent terms, you may be making real progress before your broad market share looks impressive.
How often should you measure it
Monthly is a good rhythm for most businesses. It’s frequent enough to spot movement, but not so frequent that normal ranking noise causes bad decisions.
Quarterly reviews are useful for bigger strategic questions, especially if you’re adding locations, launching new services, or restructuring your content.
If you want help turning seo share of voice from a confusing metric into a practical growth plan, X8 Web Design can help you map the right keyword sets, build stronger location and service pages, and create a search strategy that supports leads instead of vanity reporting.